


Area charts are a great way for businesses to visualize data. They can be used to track sales, trends, and other data points over time. Area charts are also easy to create and interpret. Keep reading to learn more about area charts and how businesses can use them.
What are area charts?
Area charts are a graphical representation of data where the area of each shape is proportional to the magnitude of the data point. They can be used to compare values between different points in time or to compare values between different data sets. Area charts are often used when there is a lot of data to visualize, and it is difficult to see trends or patterns with a traditional line or bar chart.
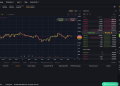
An area chart is a graphical representation of data over time. The area between the lines on an area chart represents the magnitude of the data at a given point in time. The height of the area is proportional to the value at that point. Area charts are often used to display changes in data, such as stock prices or weather data. They can also be used to compare two sets of data, such as the profits of two companies.
What are the different types of area charts?
There are a couple of types of area charts, but one of the most common is the overlapping chart. This type of chart is used to display the relative proportions of different data items. An overlapping area chart is a graphical representation of data that allows you to compare two or more sets of data. The data is displayed as a collection of overlapping areas, with each area corresponding to a data point. The size and color of the area are determined by the value of the data point. This type of chart is ideal for displaying data that changes over time, as it allows you to see how the data points compare at each point in time.
While the overlapping area chart uses transparent shading to show crossover, the stacked area chart uses solid colors or patterns. A stacked chart is used when tracking the total value and the breakdown of that total over groups. It is easy to compare the height of the stacked area to see how one group performs against another. This can be especially helpful when trying to compare proportions. For example, you might want to see how much revenue each of your company’s products generates.
How can businesses use area charts?
Area charts are a data visualization tool used to display quantitative data over time or space. They can be used to show changes in data over a period of time, relative proportions of different data sets, or the geographic distribution of something.
In business, area charts can be used to track sales, revenue, or customer growth over time. They can also be used to compare different data sets, such as the percentage of male and female customers or the percentage of customers in different age groups. Area charts can also be used to track the distribution of something geographically, such as the distribution of sales by state or country.
Area charts are often used to show how different values change. For example, you could use an area chart to show how your company’s profits have changed over the past few years. You could also use an area chart to show how the number of website visitors has changed over time. Additionally, area charts can also be used to compare different values. For example, you could use an area chart to compare your company’s profits from different years. You could also use an area chart to compare the number of website visitors from different countries.
Area charts are an important data analysis tool for businesses because they can be used to track progress and performance over time. This makes it easier to identify areas where improvements need to be made and to track the overall progress of the business.


